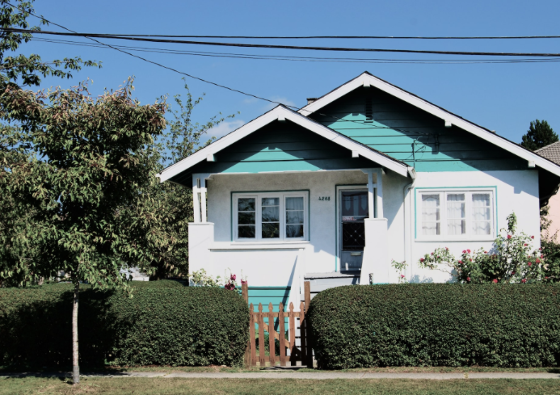
Vancouver real estate is seeing higher prices, especially detached homes where they’re now trading at June 2016’s scorching levels.
After taking a small dip last year, Vancouver real estate is back with a vengeance. The Real Estate Board of Greater Vancouver’s (REBGV) latest numbers showed detached home sales, the most expensive type of homes, saw prices increase for a third month in a row. The increase comes with higher inventory, and less sales.
Detached Prices Are Up
The price of a detached home is increasing across the REBGV. The benchmark price, that is the price of a typical detached unit, is now $1,561,000. This is a 3.1% increase from the same time last year, and a 2.1% increase from the month before. The benchmark is showing solid improvement, but it might not look like much when compared to last year’s massive 36.9% increase. This puts the benchmark price on par with June 2016.
| Month | Detached Prices |
|---|---|
| December 2015 | 1,248,600 |
| January 2016 | 1,273,100 |
| February 2016 | 1,305,600 |
| March 2016 | 1,342,500 |
| April 2016 | 1,403,200 |
| May 2016 | 1,513,800 |
| June 2016 | 1,561,500 |
| July 2016 | 1,578,300 |
| August 2016 | 1,577,300 |
| September 2016 | 1,567,500 |
| October 2016 | 1,545,800 |
| November 2016 | 1,511,100 |
| December 2016 | 1,483,500 |
| January 2017 | 1,474,800 |
| February 2017 | 1,474,200 |
| March 2017 | 1,489,400 |
| April 2017 | 1,516,500 |
| May 2017 | 1,561,000 |
Source: REBGV.
There’s been much talk about average prices falling, and that appears to be a reversing trend too. The average price of a detached sale in May 2017 went for $1,830,956, a 4.96% increase from the same time last year. For a little context, May 2016 saw the average detached sale increase in price 23%. Anyway you measure it, Vancouver detached homes are rising in prices. This doesn’t mean some of the nosebleed priced units will move at ask, but it means there will definitely be less deals to be found.
Listings Are Higher
Detached inventory across the Greater Vancouver Region (GVR) is building. REBGV logged 8,168 listings, a 5.7% increase from the same time last year. REBGV has attributed many of the listings to downsizing Boomers, looking to realize some of their profits. There’s also mounting evidence that overseas buyers liquidating assets due to capital constraints might be adding to the inventory.
| Month | Sales | Listings |
|---|---|---|
| December 2015 | 1,136 | 830 |
| January 2016 | 1,047 | 1,929 |
| February 2016 | 1,778 | 2,811 |
| March 2016 | 2,135 | 2,931 |
| April 2016 | 1,979 | 2,883 |
| May 2016 | 1,865 | 2,915 |
| June 2016 | 1,920 | 2,618 |
| July 2016 | 1,077 | 2,386 |
| August 2016 | 715 | 1,814 |
| September 2016 | 666 | 2,147 |
| October 2016 | 652 | 1,596 |
| November 2016 | 638 | 1,205 |
| December 2016 | 541 | 513 |
| January 2017 | 444 | 1,915 |
| February 2017 | 741 | 1,430 |
| March 2017 | 1,150 | 1,924 |
| April 2017 | 1,204 | 2,091 |
| May 2017 | 1,548 | 2,657 |
Source: REBGV.
Sales Are Down
An increase in inventory can be a good thing, or a bad thing – depending on how sales respond to the number. REBGV saw 1,548 sales, a 17% decline from the same time last year. This leads to a much lower absorption of listings when compared to last year, but would be strong when compared to any other city.
An increase in inventory with a decline in sales typically leads to lower prices, but Vancouver residents didn’t get that memo. Despite the greater selection available for buyers, prices are still on the rise. Much of this has to do with multiple segments of buyers turning towards the same type of home. In order for those well funded Boomers to downsize and realize profits, they’re going to be competing with first-time buyers – placing even more pressure on prices.


Comments:
Post Your Comment: